The typical Miami Beach home was worth $530,649 in September, up 1.8% in a year and four months past its low. Surfside rose 11.2%. Rents are up 3%.
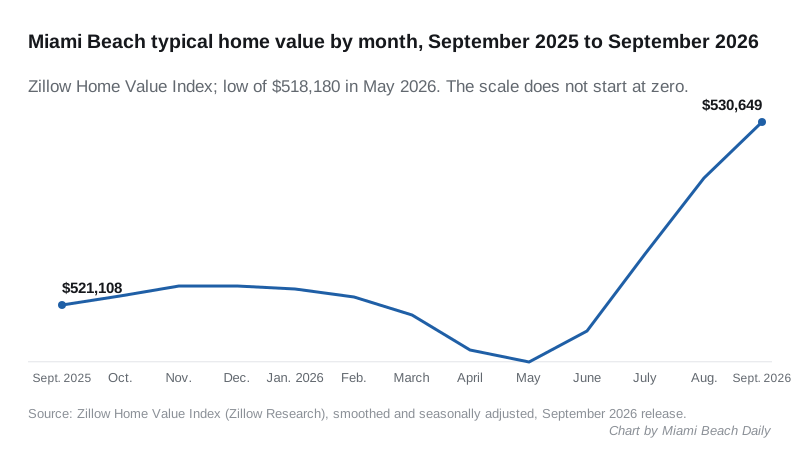
Miami Beach home values rose for a fourth straight month in September. The typical home in the city was worth $530,649, up 0.6% from August and 1.8% from September 2025.
The figures come from the Zillow Home Value Index, published by Zillow Research on Oct. 16. The index covers condos and single-family homes together and tracks the middle third of homes by value. It is a smoothed, seasonally adjusted estimate, not a sale price.
The index bottomed out at $518,180 in May after a slide that began in late 2023. It has climbed about 2.4% since then. Values are still about 5.8% below the peak of $563,105 in November 2023.
What it means for you
- Owners: values have turned up, but slowly. The gain over the year was $9,541 on the typical home.
- Buyers: Miami Beach is gaining more slowly than most of its neighbors, and its typical value is below Surfside, Miami Shores, Bay Harbor Islands and Miami.
- Renters: the typical asking rent rose 3% in a year, faster than home values.
- Property taxes: a higher market value can raise your assessment, but a homestead exemption caps the yearly rise in assessed value. See Miami Beach property taxes.
Month by month
| Month | Typical value |
|---|---|
| September 2025 | $521,108 |
| May 2026 | $518,180 |
| June 2026 | $519,804 |
| July 2026 | $523,758 |
| August 2026 | $527,744 |
| September 2026 | $530,649 |
Zillow revises past months with each release. Its August estimate for Miami Beach is now $527,744, higher than the figure it published a month ago.
How the neighbors compare
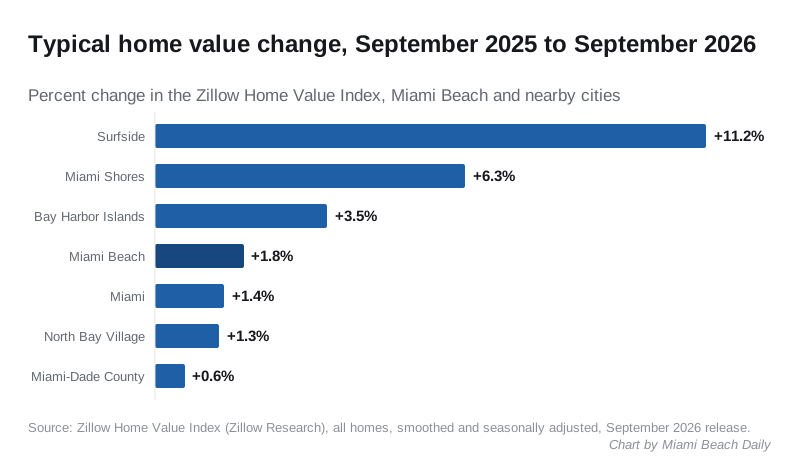
Most nearby cities gained more than Miami Beach over the year. Surfside, about five miles north, rose 11.2%. Miami Shores, about four miles northwest across Biscayne Bay, rose 6.3%.
| Place | Typical value, September 2026 | One-year change |
|---|---|---|
| Surfside | $1,347,985 | +11.2% |
| Miami Shores | $749,734 | +6.3% |
| Bay Harbor Islands | $710,754 | +3.5% |
| Miami | $583,705 | +1.4% |
| Miami Beach | $530,649 | +1.8% |
| Miami-Dade County | $523,240 | +0.6% |
| North Bay Village | $392,139 | +1.3% |
Sources: Zillow’s city and county index files. Bay Harbor Islands is about five miles north and North Bay Village about three miles west.
By ZIP code
The gains inside the city were uneven. Mid-Beach did better than South Beach or North Beach.
| ZIP code | Area | Typical value, September 2026 | One-year change |
|---|---|---|---|
| 33109 | Fisher Island | $6,993,067 | +9.7% |
| 33140 | Mid-Beach and La Gorce | $692,899 | +3.4% |
| 33139 | South Beach | $470,065 | +0.8% |
| 33141 | North Beach | $434,500 | +0.7% |
Source: Zillow’s ZIP code index file.
Rents
The typical asking rent in Miami Beach was $2,750 in September, according to the Zillow Observed Rent Index. That is up 3% from $2,671 a year earlier. Rents peaked at $2,778 in April and have been flat since June.
New homes
The city issued permits for five new housing units in August, all single-family houses, according to the U.S. Census Bureau’s Building Permits Survey. Their combined construction value was $19,914,180. The figures count homes authorized, not homes started.
More on the local market, including sale prices and how fast homes sell, is on our Miami Beach home prices page. Recorded sales are listed in real estate transfers, and neighborhood-by-neighborhood values are on Miami Beach neighborhoods.
Have your say